|
Finding Standard Deviation "By-Hand"
Using the lists, the calculator can simulate a
spreadsheet style
"by hand" computation of standard deviation.
(see Measures of Dispersion
for the FAST way to find standard deviation)
Problem: For
the data set {10, 12, 40, 35, 14, 24, 13, 21, 42, 30}, find the
range, the standard deviation, the variance, and the mean absolute deviation
to the nearest hundredth.
| Spreadsheet-style solution for standard deviation: |
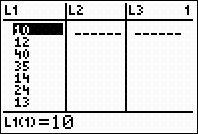
1.

Enter the data in L1. |
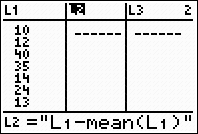
2.

Create
L2 to be the
deviations,  . .
2nd LIST →
MATH #3 mean
Using the quotes
(ALPHA +) will
create a dynamic situation where
L2 will automatically update when
L1 changes.
|
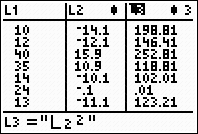
3.

Create L3 to be the deviations squared  . .
Again, using the quotes
(ALPHA +) will
create a dynamic situation where
L3 will automatically update when
L2 changes.
|
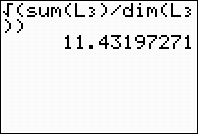
4.

From the HOME
screen.
Compute the sum of the squared deviations,
divide by the number of pieces of data (for
a population form), and take the square
root.
2nd LIST → MATH #5 sum
2nd LIST
→ OPS #3 dim
gives the dimension (size) of the list.
|
ANSWER:
population standard deviation
is 11.43

|
 |
|
|

